Java Applet:
Projection Browser
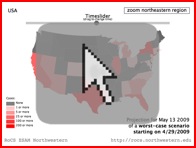
The applet lets you browse the projected number of
infecteds in a worst-case scenario over the next week
on a per-county basis.
Supported by
![]()
![]()


This research used resources of the Argonne
Leadership Computing Facility at Argonne National
Laboratory, which is supported by the Office of
Science of the U.S. Department of Energy under
contract DE-AC02-06CH11357.

![]()
Team

From left to right, top: Christian Thiemann,
Alejandro Morales Gallardo, Rafael Brune, Dirk
Brockmann. Bottom: Vincent David, Olivia
Woolley, Daniel Grady.
Related Links
![]() CDC H1N1 Flu Website
CDC H1N1 Flu Website
![]() WHO Influenza A(H1N1) Website
WHO Influenza A(H1N1) Website
![]() Illinois Dept. of Public Health
Illinois Dept. of Public Health
New York Times:
Predicting the Flu With the Aid of
(George) Washington
(May 4, 2009)
LA Times:
Scientists see this flu strain as
relatively mild
(April 30, 2009)
Yahoo! News:
'Worst Case' Scenario for Flu
Estimated
(May 1, 2009)
Le Monde:
Les chemins du virus passent par
les billets de 1 dollar, sur
Internet
(May 5, 2009 – French)
Welt am Sonntag:
Kleine Geschichte der großen
Unsicherheit
(May 3, 2009 – German)
WBEZ Chicago Public Radio:
Eight Forty-Eight
(Apr 29, 2009)
WBEZ Chicago Public
Radio (Apr 28, 2009)
ABC7 Chicago
(Apr 30, 2009)
FOX News Chicago
(Apr 27, 2009)

Computational quantitative projections for H1N1 flu dynamics in the United States
Please note: The research covered on
this page is on computational forecasts of the initial
outbreak of H1N1 in the United States in the spring 2009
when case counts were still comparatively small. Our
simulations were designed to specifically target the
initial outbreak time window of the pandemic. Here, we do
not report on projections for the time course of H1N1
after June 2009. This page is no longer updated.
Last updated: June 3, 2009 9:00pm (CDT)
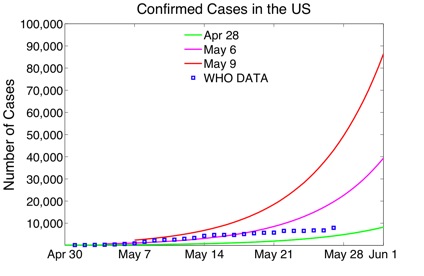
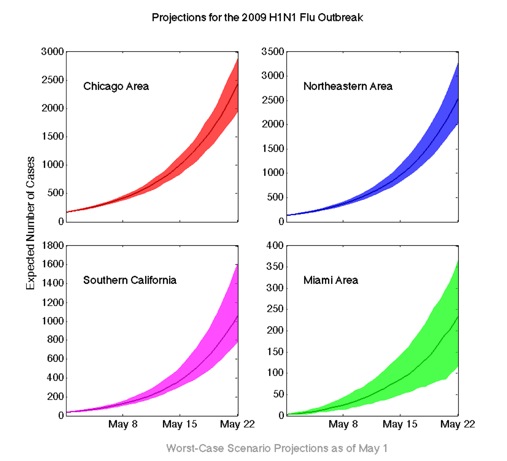
On May 15, a CDC official estimated the total number of influenza-like illnesses in the US to be beyond 100,000 with a large fraction caused by the new strain of H1N1 Influenza. This is in evident conflict with our first estimate of 1,700 cases in the US by the end of May (green line in the plot below). We would like to emphasize that this figure was obtained within 4 days of the first alert with very preliminary information. Nevertheless, as noted in this site, our projections were subject to constant verification and calibration. The subsequent two weeks, we produced new projections on a frequent basis, improving the quality of our results. In fact, within a week, our projections for the end of May estimated 40,000 in the US (magenta line) and by May 9 (two weeks after the initial alert emitted by the CDC) the estimate was close to 90,000 cases in the US (red line).
About this Project
Initial Phase: ProjectionsOn April 24, WHO emitted an epidemic alert about an influenza-like illness in the United States and Mexico. Within a week, the situation evolved rapidly, with 11 countries reporting cases of influenza A(H1N1) infection. Particularly at the onset of an emerging epidemic, early projections are of vital importance to asses the short term impact of the novel infection.
On April 28, we posted our first quantitative projections for H1N1 flu dynamics in the US. Due to the novelty of the disease, information about the virus was still preliminary and subject to further investigation, therefore we restricted our detailed projections to a four-week timeframe.
With our projections, we correctly identified hot spots and the overall geographical pattern of the novel virus in the United States. We proportionately estimated the number of cases that would be detected for each county of the continental US.
As of May 19, H1N1 influenza was widespread in the United States. The total number of cases was at 5,469 individuals and the infection had been reported in all but two states. Since the large majority of cases showed mild symptoms and testing shifted focus to the more severe cases, the official number of cases is no longer a good indicator for the actual cases of illness.
Sustained Phase: Analysis of Long-Term Impact
Since May 21, we are shifting our focus towards a detailed analysis of the geographical pattern of the novel infection and assessment of the long-term impacts of this new virus. From the information obtained so far, we are also extracting information about this virus that will allow for a better understanding of the disease and more accurate models.
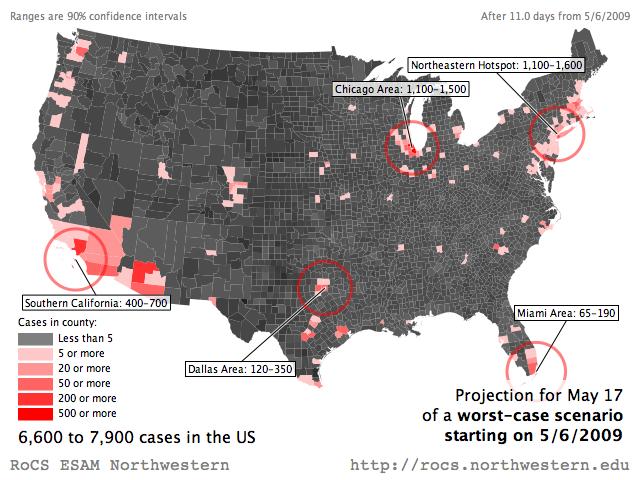
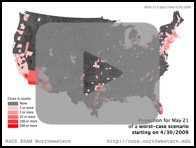
Last Projection
The following maps show the projected number of cases in the United States at the county level. The range of numbers represent the most likely outcome according to our model, a confidence interval of 90% (see below for explanation). This is a worst case scenario, in which no containment measures are taken to mitigate the spread. We used the confirmed cases as of May 6th for calibration and project from there on.Because we adjust our simulations every 24–48 hours, our projections are subject to changes. At the moment our model projects a probable range of 6600–7900 by May 17, 2009 in the United States.
| Projection for May 17 |
 |
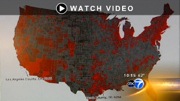
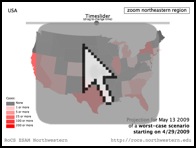
| Video: Projection until May 22 | Java Applet: Projection Browser | |
 |
 |
What is the worst case scenario? The worst-case scenario presented here is the worst-case for our model, which makes many assumptions about the way a disease spreads and the way people move. We attempt to make our predictions fit real-world numbers as handsomely as possible by making realistic assumptions, but since the model cannot ultimately account for every real-world factor the scenario presented here may be better or worse than the actual outbreak.
What do the numbers in our projections mean? Our simulations estimate the range of expected cases for different regions in the United States. These numbers are a high-likelihood range, and the actual outbreak may deviate from the projections. Deviations are particularly likely during the onset of the outbreak when only a very small number of cases have been reported.
How can the worst case scenario projection be smaller than the true reported cases? In certain areas we project a smaller number of cases than are actually reported. This is because the projections are probabilistic, like the weather report. Although we believe the projected numbers are quite likely and are elated when the data match our predictions, larger or smaller values can occur. As scientists, our job is to be as candid as possible with the public and avoid futzing with the data.
We are using high performance computational techniques and multi-layer, large scale computer simulations to project the time course of the H1N1 flu epidemic in the United States. Our simulations yield projections and risk assessments of the epidemic outbreak in a worst case scenario, in which no containment measures are taken to mitigate the spread. Therefore, the actual case numbers are expected to be smaller as mitigation strategies and containment efforts become effective. We are constantly updating our forecast, taking into account new information on confirmed cases and more precise information on the transmissibilty and disease-specific parameters.
Our modeling is based on the current knowledge of the disease parameters and takes into account the backbone of spatial spread: A precise estimate of human mobility on spatial scales between a few and a few thousand kilometers. Our projections resolve the expected dynamics down to the county scale (3,109 counties in mainland United States). Details of our modeling approach are provided on the Methodology page.