Community Structure in Multi-Scale Transportation Networks
Large-scale communities and their geographical boundaries are key determinants of various human-mediated, spatially-extended, dynamical phenomena. The geographic spread of emergent human infectious diseases such as SARS (severe acute respiratory system) and human influenza A are prime examples. However, the quantitative impact of large scale community structures and their boundaries is difficult to assess. In this project we investigate the network of human traffic between the counties in the US. The aim of this study is to investigate the structure of large-scale communities in the United States. As part of the research we employ data from the online bill-tracking game www.wheresgeorge.com measuring the amount of currency that passes between counties. This database contains information for over 11 millions bills, and allows us to estimate the amount of human travel between the 3109 counties in the continental United States. We develop two new methods for detecting community structure in networks, and we develop a new method for measuring the correlation between two sets of weighted boundaries. Our methods and findings are discussed in detail in a forthcoming paper; one of the methods we employ is also described in our video Follow the Money.Although geographic proximity still dominates human activities, they can no longer be characterized by local interactions only. For example, on the US air transportation network, more than 17 million passengers travel each week across long distances. However, including all means of transportation, 80% of all traffic occurs across distances less than 50 km. The interplay of strong connections on both local and long-distance scales makes the definition and quantification of meaningful geographic borders particularly difficult.
We apply an approximate, stochastic Monte-Carlo method to find high-modularity partitions of the multi-scale mobility network (see visualization). In an ensemble of
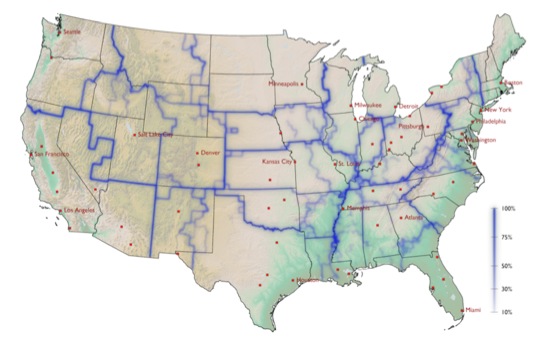
Note that these borders can effectively split states into independent patches, as with Pennsylvania, where the most significant border separates the state into regions revolved around Pittsburgh and Philadelphia. Other examples are Missouri, which is split into two halves, the eastern part dominated by St. Louis (also taking a pieces of Illinois) and the western by Kansas City, and the southern part of Georgia, which is effectively allocated to Florida. Also of note are the Appalachian Mountains. Representing a real geological barrier to most means of transportation, this mountain range only partially coincides with state borders, but the effective mobility border is clearly correlated with it. Finally, note that effective patches are often centered on large metropolitan areas that represent hubs in the transportation network, for instance Atlanta, Minneapolis and Salt Lake City.
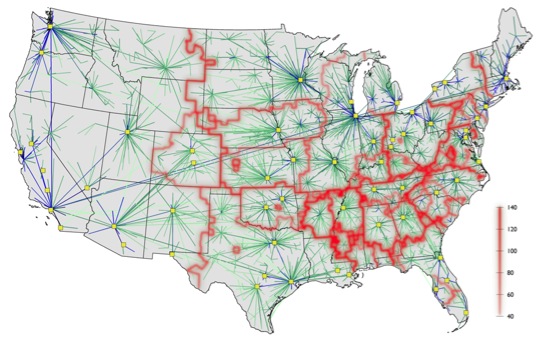
Although we find that the borders revealed by our technique of superposing are quite robust, the stochastic algorithm we use does not indicate anything about the particular substructures in the network that cause these borders to be so robust. We developed an alternative technique, based on comparing the similarity of shortest-path trees, to investigate this further, and find another set of borders that correlates strongly with the first, and which surround edges in the network that appear frequently in shortest-path trees.
The borders that our methods reveal have a significantly strong correlation with state borders and the borders of Economic Areas defined by the Bureau of Economic Analysis.
C. Thiemann, F. Theis, D. Grady, R. Brune and D. Brockmann, in PLoS ONE, Nov 2010.
Follow the Money
Detecting Communities in the United States

Related Links
Money tracking website: www.wheresgeorge.comRelated Articles
Related Projects

Find out more...
![]()
![]()